
Comparing to Known Data and Hitting a Wall

This week I focused on understanding what my data represents and how it compares to what is already known. To do this I used the gseapy library in Python. This library allows a user to use a Gene Set Enrichment Analysis computational method to analyze whether genes show statistical significance with regards to different phenotypes. To do this, the gseapy library uses actual gene expression data. This week, I had it use data from TRRUST, which is a manually created database thousands of relationships between genes.
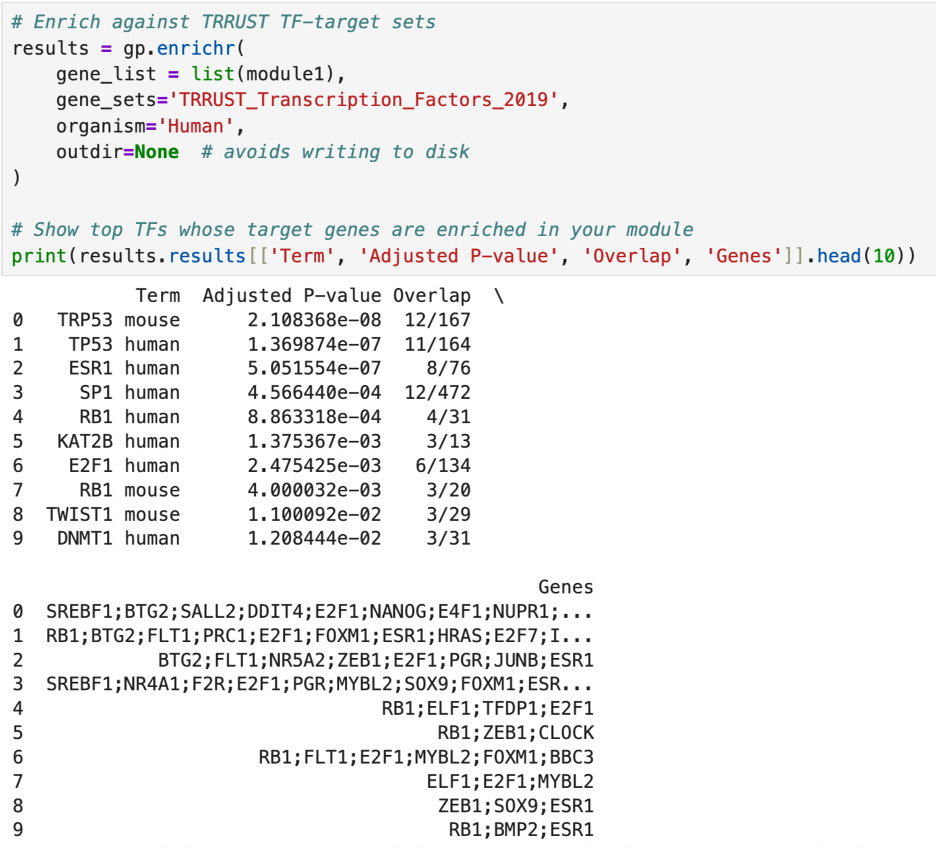
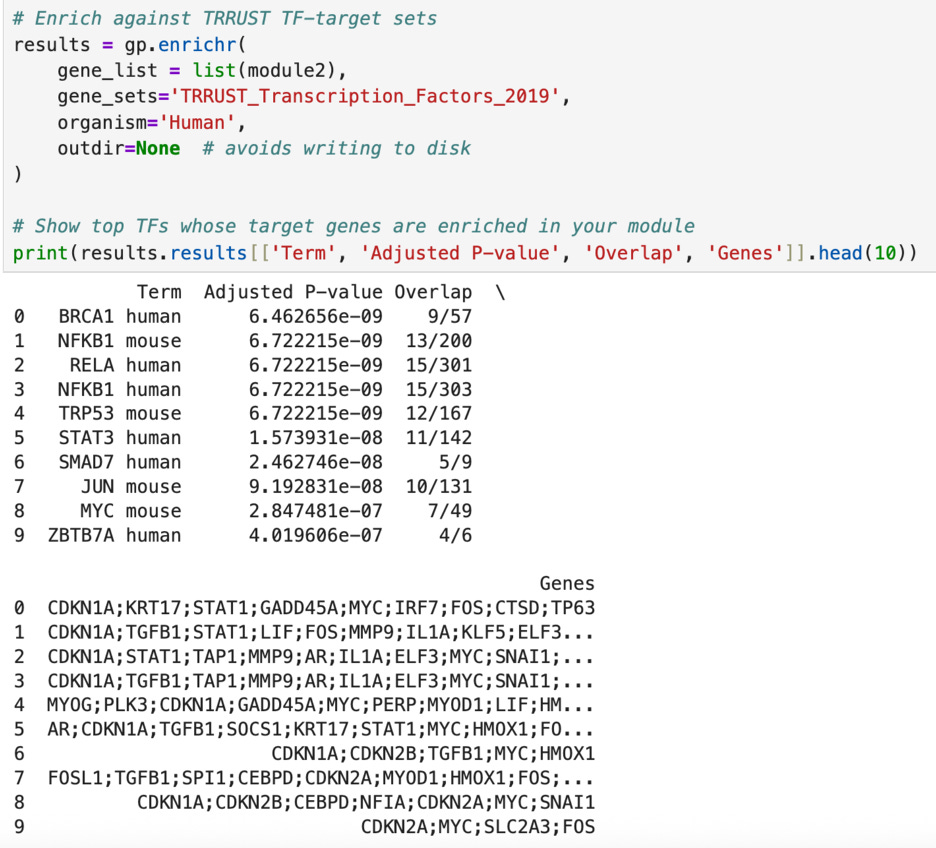
First, I tested the enrichment of the two top clusters of transcription factors (module1 and module2). The enrichment of a cluster means cross checking the genes in the module with genes that are known to be targets of known “important” transcription factors such as TP53 and BRCA1. For example, TP53 has 164 main target genes and 11 of them appear in module1 (as shown below). The p-value, 2.108368e-08 is extremely small, indicating that this overlap is of statistical significance and is not due to chance. Similarly, in module2, 9 out of the 57 targets of BRCA1 are present, with a p-value of 6.462656e-09. In fact, out of the top ten transcription factors cross checked with my list, each had an extremely small p-value—especially in module2. This all indicates that the genes that I have identified are highly likely to be indicators of cancer gene expression and are not a fluke.
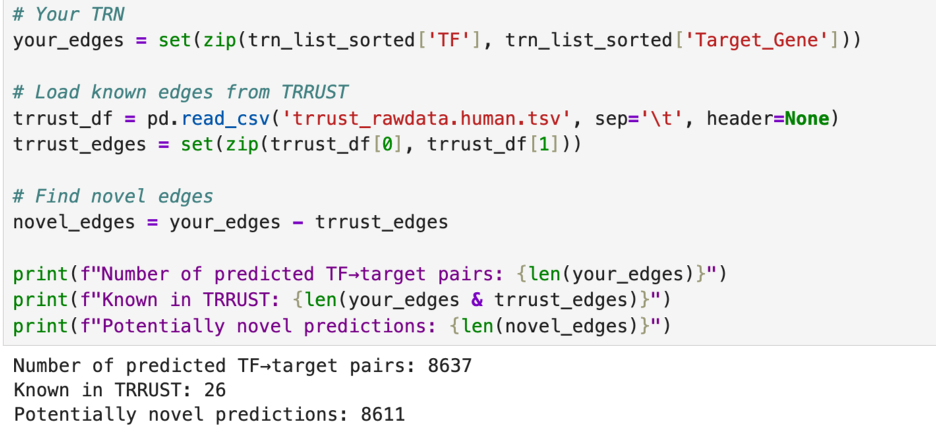
After this, I wanted to test how many of the genetic relationships that I graphed last week are already recorded. I again used the TRRUST database, but this time I used their downloadable file of all 8,427 regulatory links between 795 transcription factors and 2,067 non transcription factors in the human genome. I figured that if it is not in that list, it would be safe to assume that I found something new.
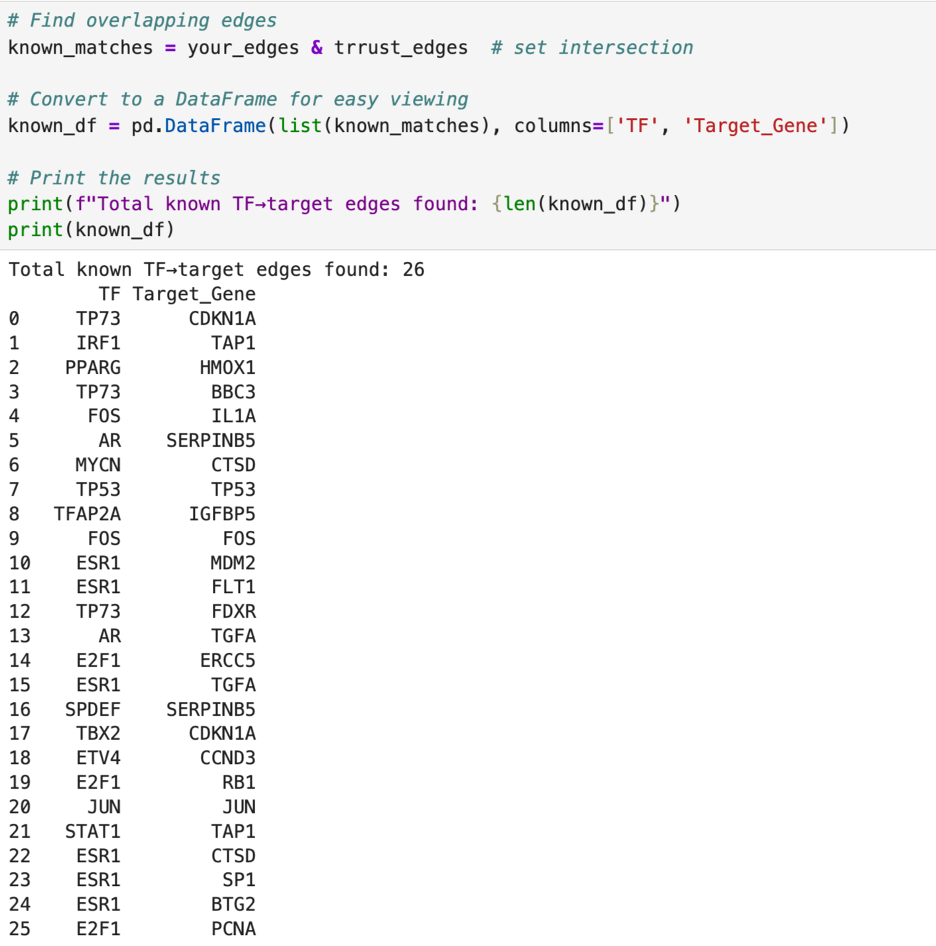
In my analysis, I found 8,637 regulatory links. This is already more than the number in the TRRUSR database. When I compared my findings to those in the TRRUST database, I found only 26 overlaps. This leaves 8,611 possible regulatory links for me to explore.
Since I had so many possibilities for matches, I wanted to narrow it down. I did this by sorting the connections between transcription factors and target genes by Lasso coefficient. The larger the magnitude (or absolute value) of the Lasso coefficient, the greater the chance that the connection is statistically significant. I also removed all of the instances of self-regulation so that I am only looking at inter-gene interactions.
The issue now is that I need to find out what these connections mean—if anything. The way to do this would be to see if there is a pattern in the way these are expressed in patients and the patients’ outcomes with breast cancer. The issue is that patient data from medical studies is usually classified due to patient privacy and protection laws like HIPAA, so I need to brainstorm what I can do with my findings.
Thank you so much for reading and please stay tuned for updates!