
Graphing my Data

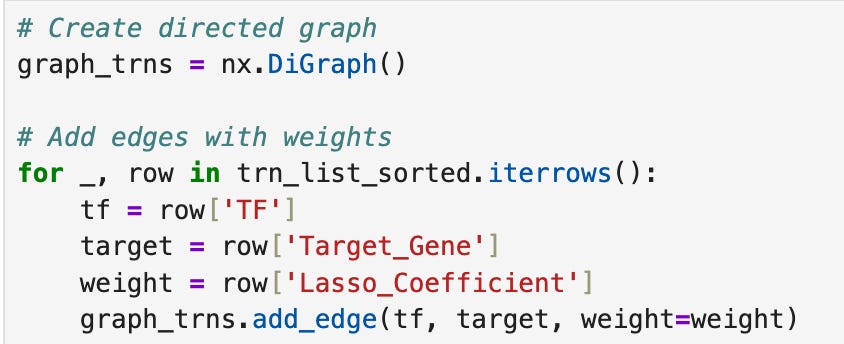
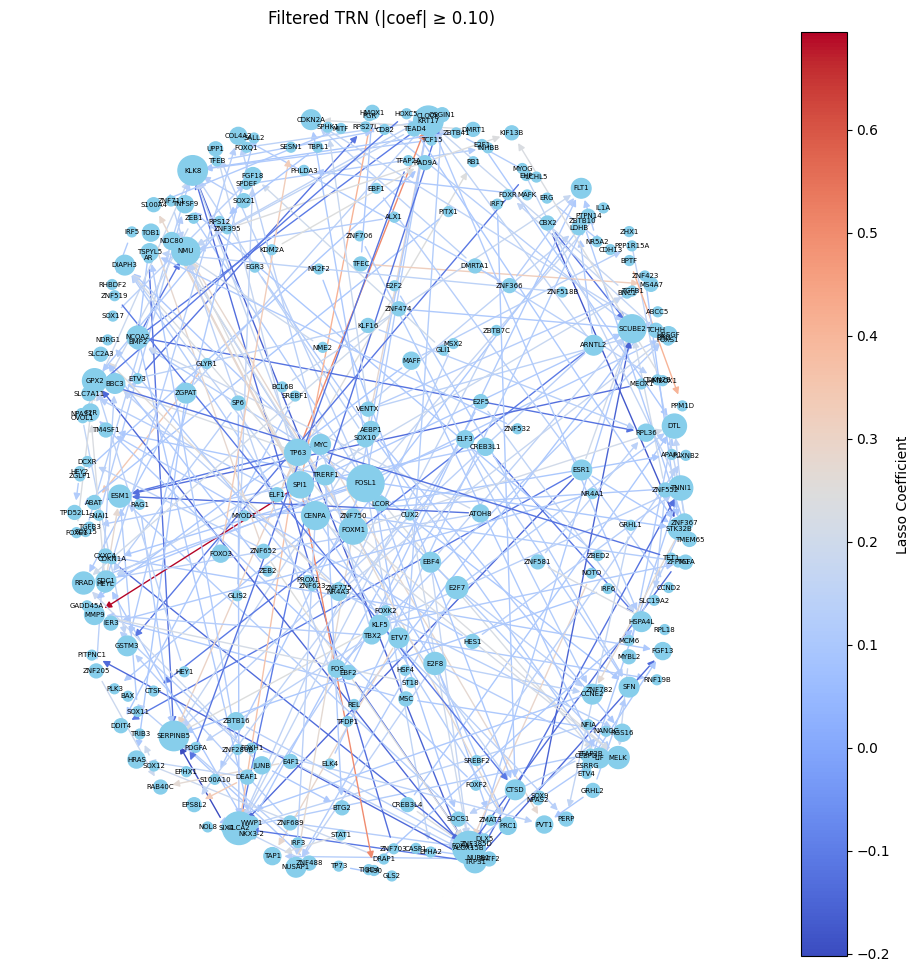
This week, my goal was to identify genes that are regulated by many transcription factors and identify transcription factors that regulate many genes. To do this I used the networkx and matplotlib python libraries to create a visual representation of my data. I sorted the data by transcription factor and target gene as nodes (points) in the graph and used Lasso constants to give each node a weight. The closer the absolute value of the constant is to zero, the less effect it has. Negative constants indicate inhibition of another gene and positive constants indicate enhancement of another gene.
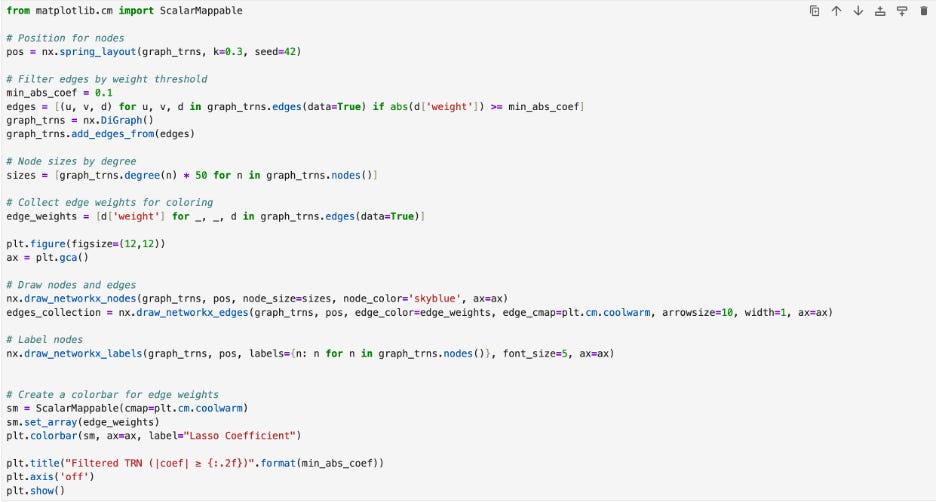
Then I made the graph by adding edges to connect the transcription factor nodes. I gave the nodes weight so that they would appear in color. Then I used matplotlib and the network drawing tools to create the graph. I color coded the edges with a cold to warm gradient with blue corresponding to the lowest values and red corresponding to the highest ones.
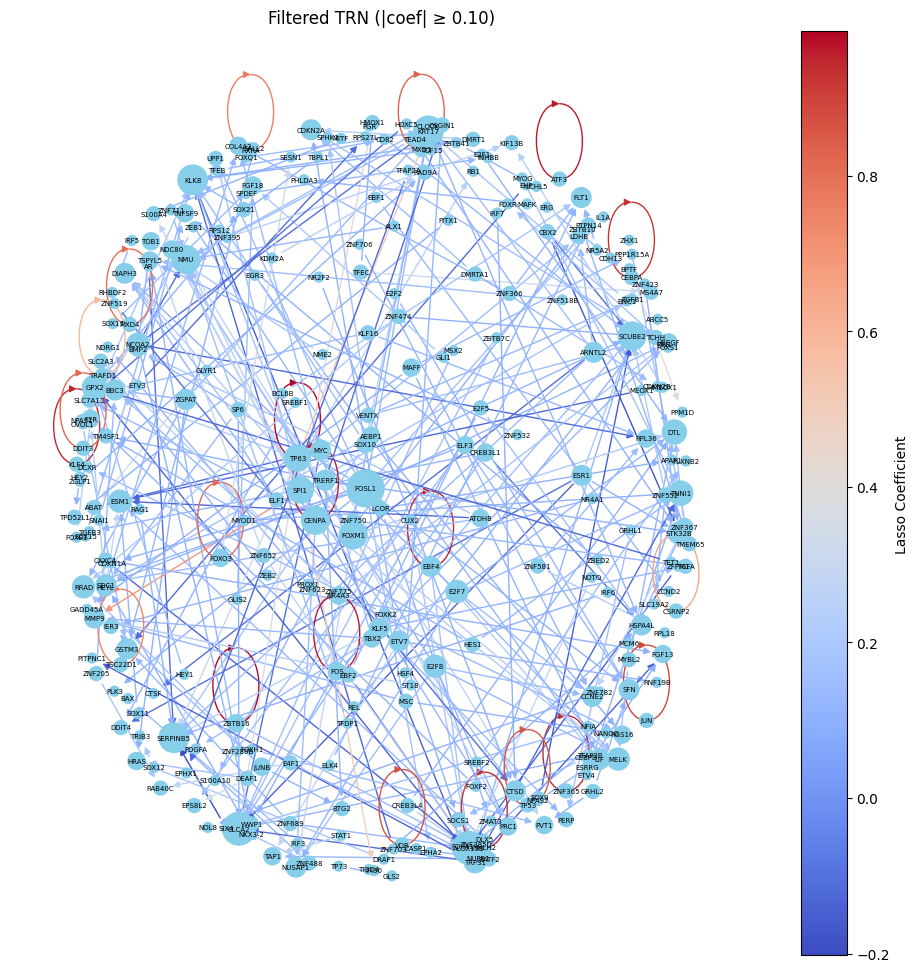
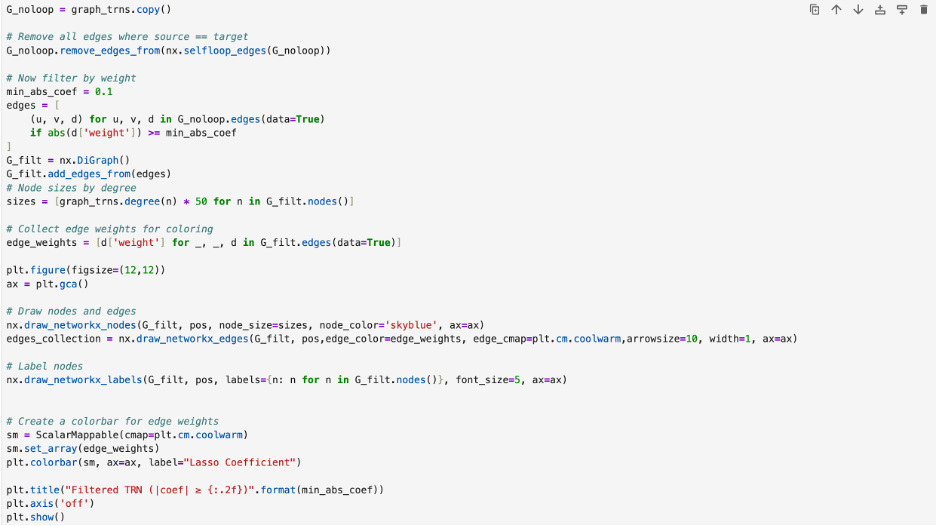
The graph above has red loops around it. These loops indicate self-regulation. Since I wanted to focus on cross gene interactions, I got rid of the loops and remade the graph. I did this by saving a copy (so that I would not lose the original graph) and removing edges that pointed back on the original node.

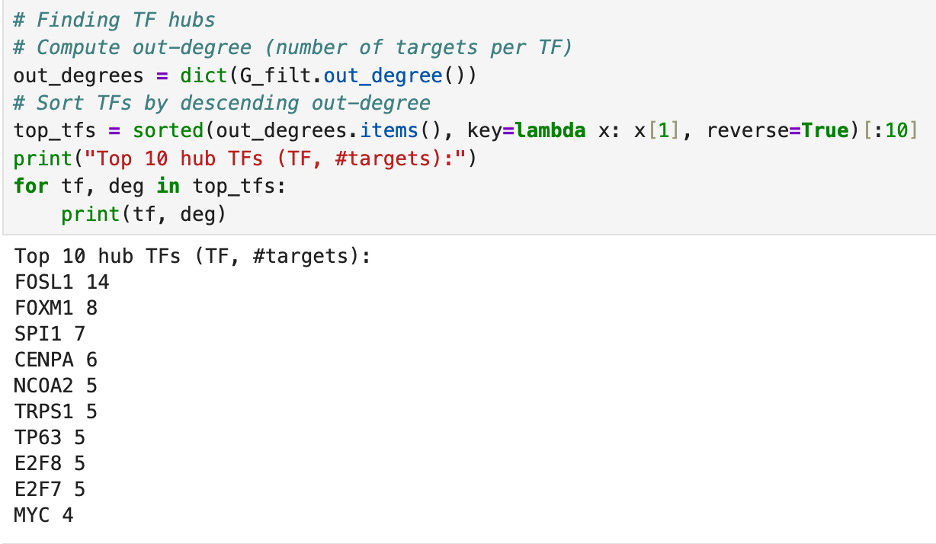
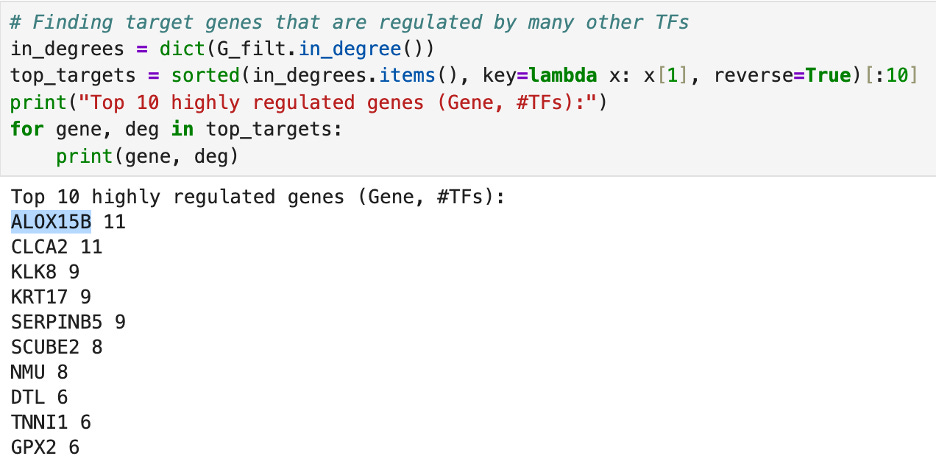
Then, I ran some tests to find which transcription factors are the most central. First, I used the .out_degree() and .in_degree() actions to count which transcription factors regulate the most other genes and which transcription factors are regulated by the most genes respectively. The number TF hub, regulating the most other genes, is FOSL1 and the number one regulated gene is ALOX15B.
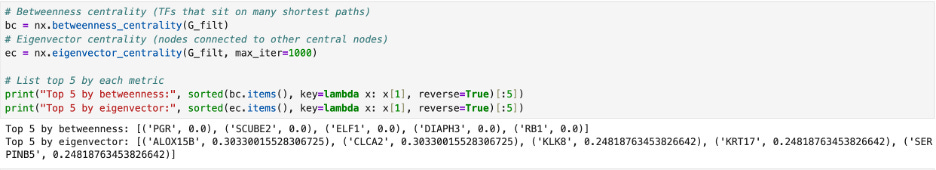
Then I tested for betweenness and eigenvector centrality. Betweenness centrality is when a node is in the middle of a path. This would act as a bridge. When I ran this on the graph data, I got a bunch of zeros. This means that the transcription factor network path lengths are all one. Eigenvector centrality denotes how important a node is based on how many hubs it is neighbors to. So if a transcription factor is not a hub, but it is connected to one, it would be denoted as more important. The results of this are pictured below.
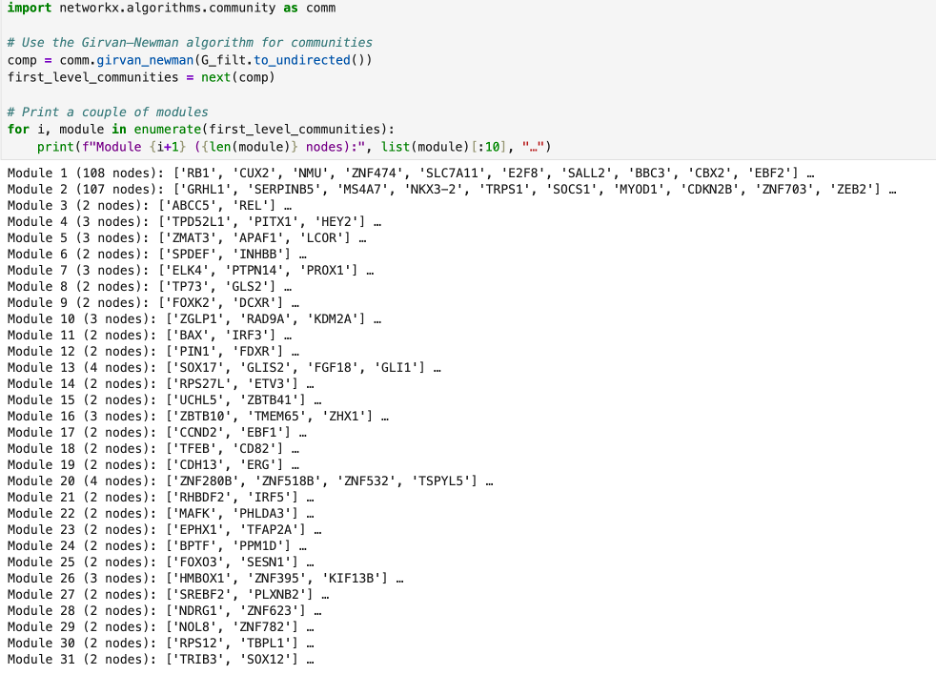
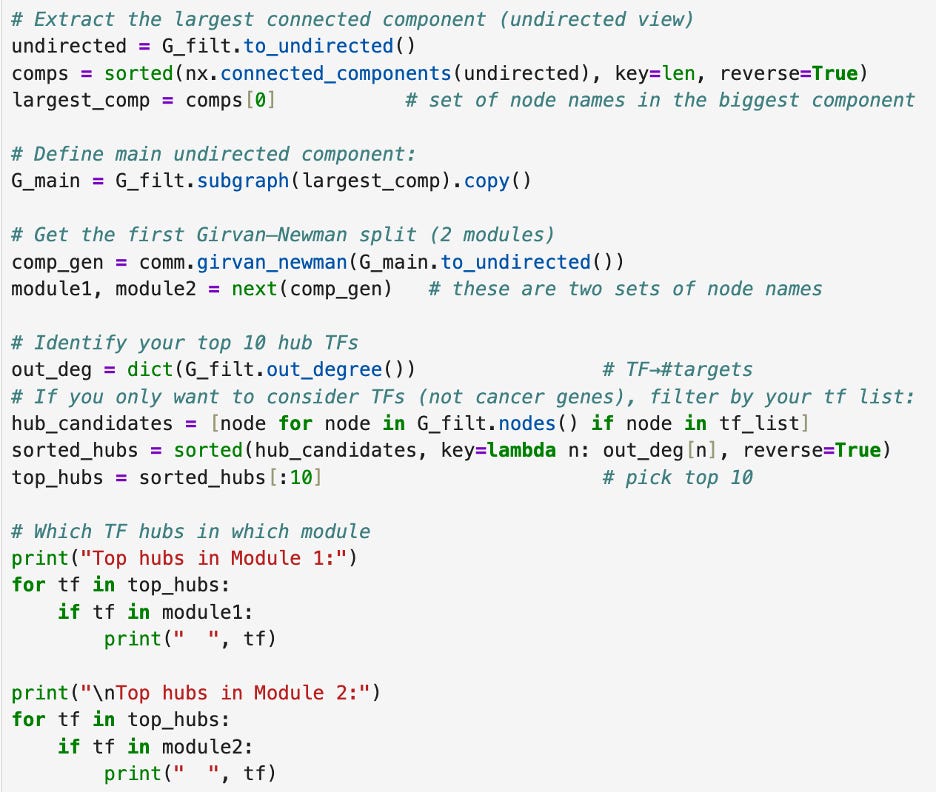
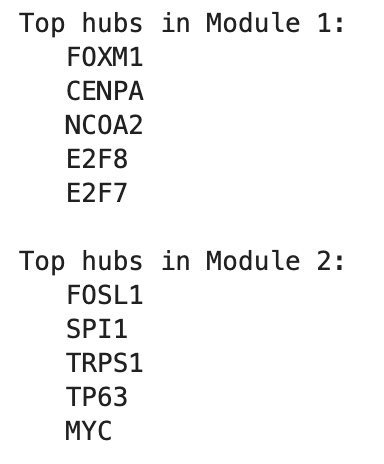
I then used the Girvan-Newman algorithm to determine if there were any communities of transcription factor interaction. Even though each path was very short and no transcription factor lay in the middle of a path, there are two big communities of transcription factor interaction. The first has 108 nodes and the second has 107 nodes. The other hubs were all small, with 4 nodes or less. I then checked which of the ten top transcription factors that I had found are in which community, as shown below.
The two larger hubs are what my future analysis will most likely focus on, as they indicate a network of tightly connected transcription factors. Still, I do have to then cross-check this analysis with an outside source such as the TRRUST database which holds data of human transcription factor networks (which is what I plan to do in the coming week).
Thank you so much for reading and please stay tuned for more updates!
Good work Anya. I understand the goal to understand regulation deeply in terms of the genes and the transcription factor. Is there a more specific goal you are going after by doing this? Adding that in the beginning of this analysis will help ground the whole analysis a bit better. Thanks