
Playing Catch Up

This week I played catch up. In case you don’t remember, last week, I faced a giant setback because I realized that the data I was using was missing a lot of key transcription factors such as BRCA1 and BRCA2. This meant that I could not do a lot of analysis with my data. That meant that my goal this week was to find a data set with all the necessary transcription factors and redo all the analysis I had done so far.
The data set that I used comes from the University of Santa Cruz and has an extensive list of gene expressions in 1218 patients. I checked that a few important transcription factors were present in the data and got confirmation, so I continued with my analysis.
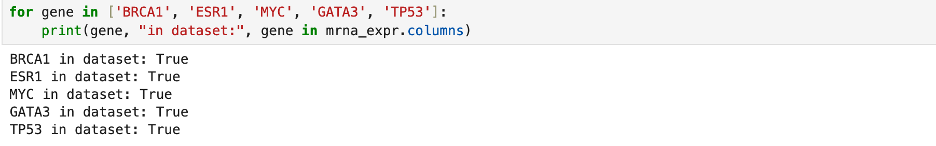
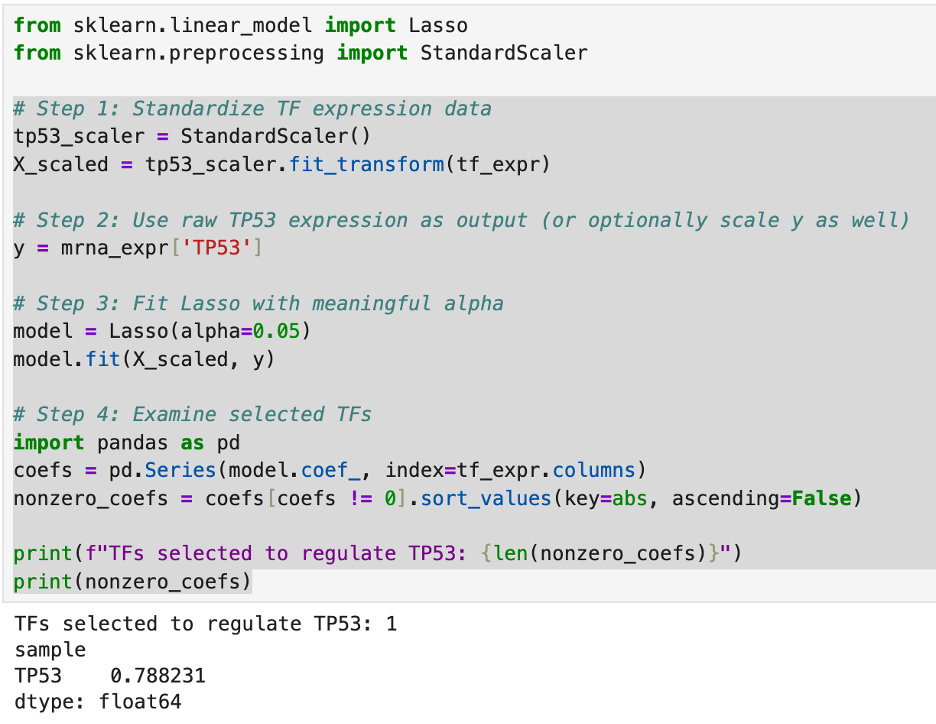
Then I recreated my data sets of the transcription factors and cancer genes. Then, I reran the Lasso code on TP53. What I found was that, when in a data set with countless other genes, the patterns found are that TP53 is largely self-regulated.
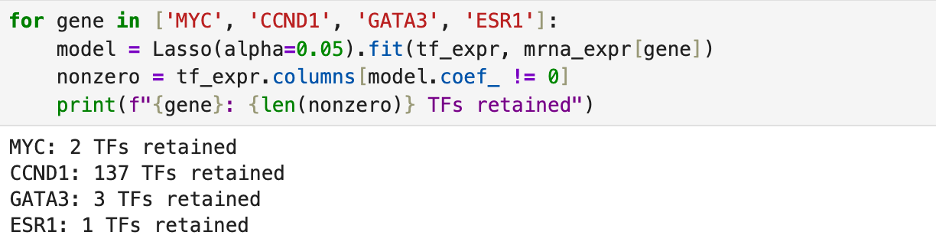
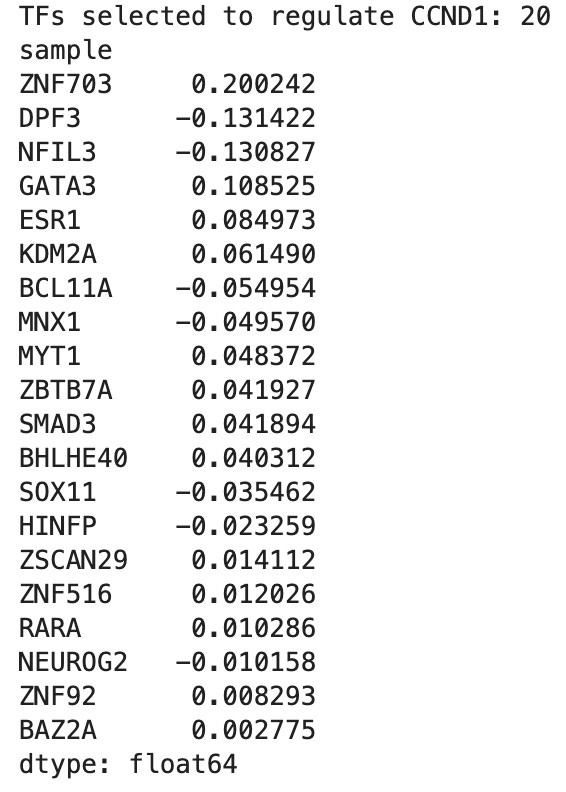
I then checked a few more genes to see how many transcription factors regulated their expression. In doing this, I found that many genes are largely self-regulated. I did find that CCND1 expression, however, is regulated by numerous genes.
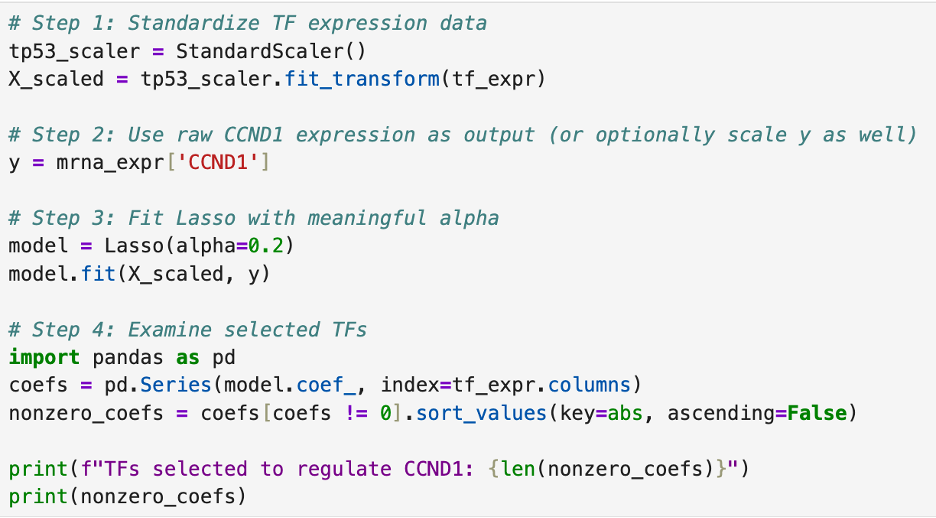
Then, I ran the same test I did for TP53 to find the transcription network of CCND1. The data (pictured below) means that the computer software found patterns in the data indicating a connection between CCND1 and the twenty other genes. This could indicate a transcriptional network of genes that regulate CCND1 but is not a 100% guarantee.
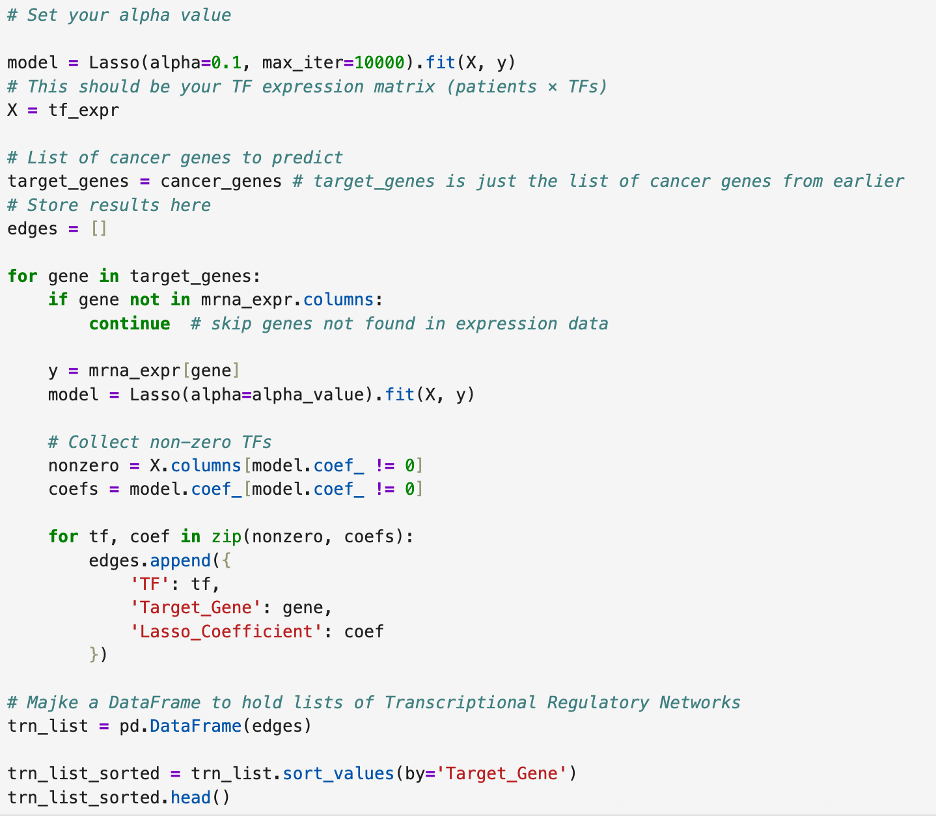
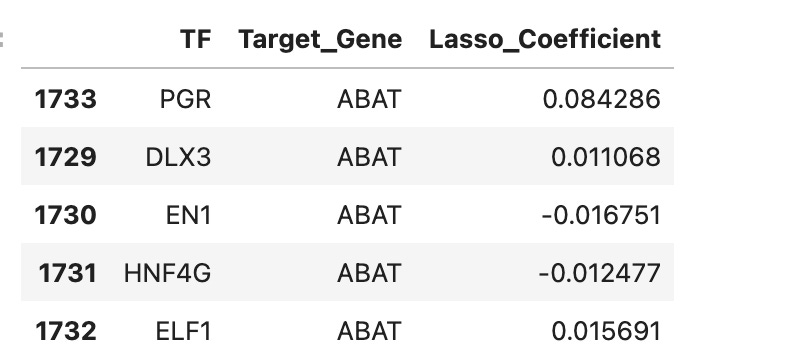
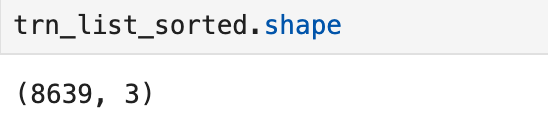
Finally, I used a loop to do the same analysis for all genes in the list of breast cancer related genes. The reason over 8000 rows is included is because each transcription factor could be involved in the regulation of multiple genes (so it is not just a list of each transcription factor). A snapshot of the table is pictured below.
In the next weeks, there are two avenues I plan to pursue.
First, I plan to use the networkx library in Python to create a visual model of my data. This will allow me to actually see what I am trying to analyze, which is helpful because only looking at the numbers makes it hard to see patterns due to the sheer amount of data. For example, it is virtually impossible for me to look at over 8000 data points in a timely manner, but a physical representation would allow me to see transcription factors that are hubs for interactions.
Second, I plan to use existing transcriptional regulatory network data to compare with my findings. It will give me a way to fact check what I have found. Existing data that matches my findings corroborates my analysis. Differences either mean that there is some discrepancy in my analysis or that I have found something new.
Thank you so much for reading!